


In the realm of modern business operations, data has become a cornerstone for informed decision-making. However, raw data alone holds limited value without effective interpretation and analysis. This is where data visualization comes into play, and with Workday Prism Analytics, businesses can harness the power of data visualization to uncover insights, patterns, and trends that drive strategic growth. In this comprehensive guide, we’ll explore how Workday Prism Analytics empowers organizations to master the art of data visualization and the role of Workday Prism Analytics Training in achieving this mastery.
Understanding Data Visualization
Data visualization is the process of representing complex data sets visually, using graphs, charts, and other visual elements. This approach transforms intricate data points into easy-to-understand visuals, enabling users to identify patterns, correlations, and outliers at a glance. Visualizations provide a clear and concise way to communicate insights, making data-driven decisions more accessible to stakeholders across an organization.
Introducing Workday Prism Analytics
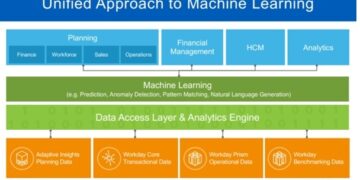
Workday Prism Analytics is a powerful tool that extends the capabilities of the Workday platform. It enables users to aggregate data from various sources, including HR, finance, and operational systems, and transform it into meaningful visualizations. With Workday Prism Analytics, users can create interactive dashboards, charts, graphs, and reports that deliver actionable insights in real time.
Advantages of Workday Prism Analytics for Data Visualization
Deeper Insights
Workday Prism Analytics enables users to drill down into data, exploring layers of information to uncover deeper insights. This capability allows organizations to identify trends and correlations that might otherwise go unnoticed.
Real-time Analysis
With data updated in real-time, users can monitor key metrics and KPIs as they evolve. Real-time analysis enables quicker decision-making, as users are equipped with the most current information available.
Customizable Dashboards
Workday Prism Analytics provides a user-friendly interface for building customizable dashboards. Users can arrange visualizations based on their preferences and requirements, creating a tailored view of the data.
Predictive Analytics
Workday Prism Analytics supports predictive analytics by allowing users to model scenarios and trends based on historical data. This forecasting capability empowers organizations to plan for the future with greater accuracy.
Cross-functional Insights
Since Workday Prism Analytics can pull data from various systems, it promotes cross-functional insights. HR, finance, and other departments can collaborate more effectively by analyzing shared data.
Enhanced Communication
Visualizations simplify the communication of complex data to stakeholders who might not have a technical background. This promotes data-driven decision-making across the organization.
Workday Prism Analytics Training
While the benefits of Workday Prism Analytics are evident, the tool’s true potential can only be fully realized through effective training. Workday Prism Analytics Training is essential for ensuring that users, whether they’re HR professionals, financial analysts, or executives, can utilize the tool to its maximum capacity. Here’s why training is crucial:
Optimal Utilization
Workday Prism Analytics is a robust platform with numerous features and functionalities. Training equips users with the knowledge needed to navigate the tool effectively, helping them leverage its full potential.
Efficiency and Productivity
Proper training reduces the learning curve associated with new software. Users can become proficient more quickly, leading to increased efficiency and productivity.
Customization
Workday Prism Analytics offers a range of customization options. Training enables users to tailor dashboards and visualizations to their specific needs, ensuring that the tool serves their unique requirements.
Advanced Features
Training sessions often delve into advanced features and techniques. Users learn how to perform complex analyses, create predictive models, and uncover insights that might not be immediately obvious.
Troubleshooting
As users become familiar with the tool, they also learn how to troubleshoot common issues. This self-sufficiency reduces reliance on IT support and allows for smoother operations.
Mastering Data Visualization with Workday Prism Analytics
Mastering data visualization with Workday Prism Analytics, organizations should follow these key steps:
Identify Objectives
Determine the specific insights and metrics you want to visualize. Clearly define your goals to guide the visualization process.
Data Preparation
Ensure your data is clean, accurate, and well-structured. Effective visualizations are built on reliable data sources.
Choose Visualization Types
Select appropriate visualization types based on the nature of the data. Line charts, bar graphs, scatter plots, and heatmaps are just a few options.
Build Dashboards
Create dashboards that provide an overview of key metrics. Arrange visualizations logically to present information in a coherent manner.
Interactivity
Take advantage of interactive features offered by Workday Prism Analytics. Allow users to filter data, drill down, and explore different dimensions.
Tell a Story
Craft your visualizations to tell a story. Highlight trends, anomalies, and relationships that provide actionable insights.
Regular Review
Continuously review and update your visualizations as your data changes. Ensure that the information presented remains relevant and up-to-date.
In Conclusion
Workday Prism Analytics offers a transformative way to master data visualization and turn raw data into actionable insights. By leveraging its capabilities and investing in “Workday Prism Analytics Training,” organizations can equip their teams to create impactful visualizations that drive better decision-making, foster collaboration, and ultimately contribute to their success in today’s data-driven world.